
Austin Adds Housing Inventory – Austin Market Stats
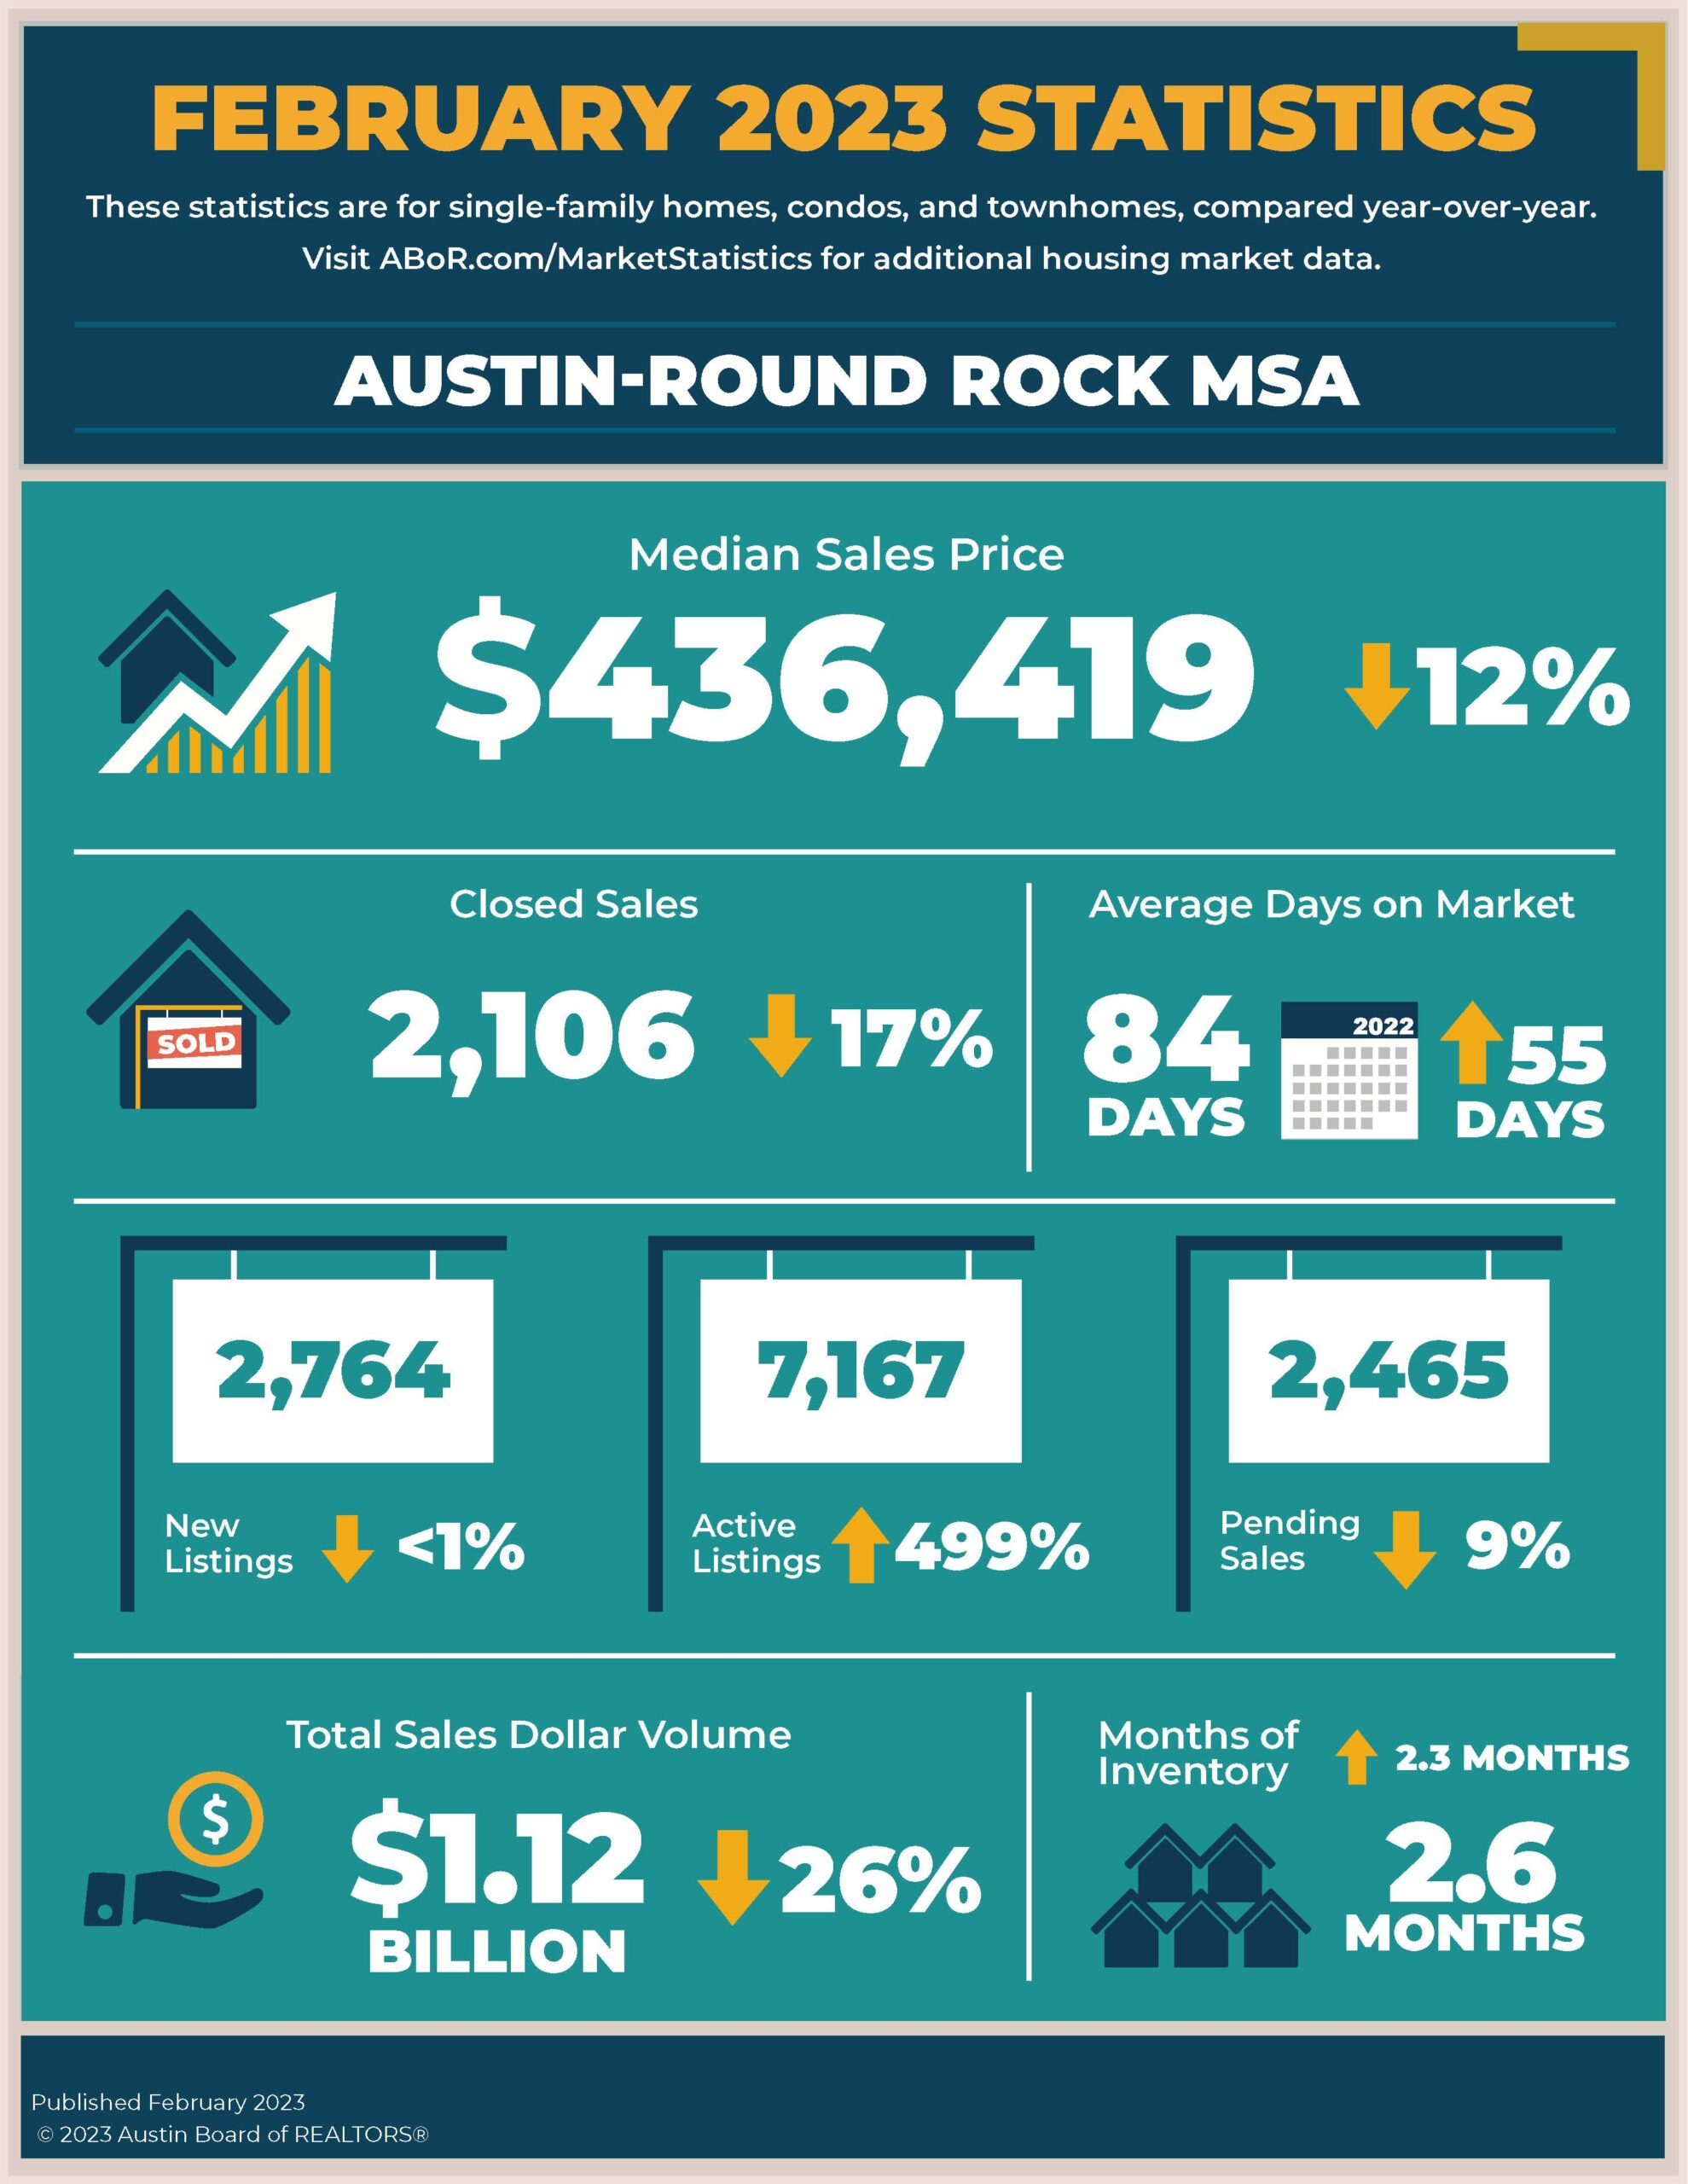
In February, home buyers continued to gain leverage across the Austin-Round Rock MSA as housing inventory increased to 2.6 months according to the Austin Board of REALTORS.
Austin’s housing market is trending in the right direction. Buyers have more options and negotiating power with each passing month, and sellers have more time to make their next move,” Ashley Jackson, 2023 ABoR president, said
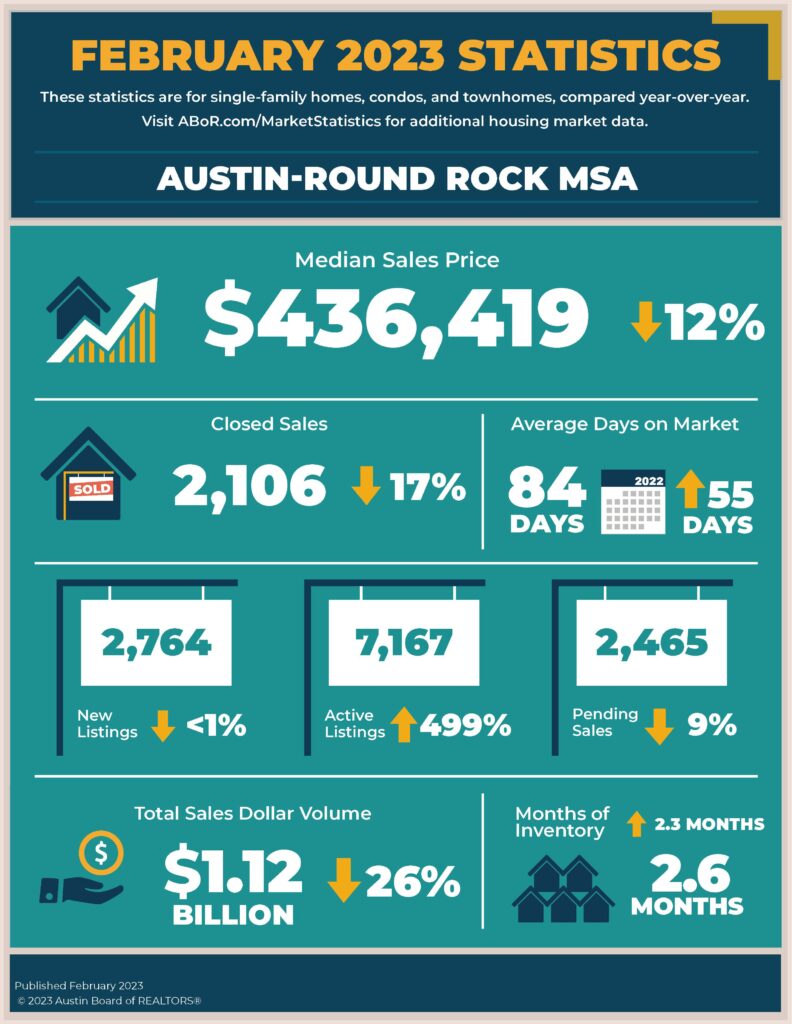
Last month, monthly housing inventory increased 2.3 months to 2.6 months of inventory, and homes spent an average of 84 days on the market, up 55 days from February 2022 across the MSA. The median home price fell 12.2% to $436,419 while residential home sales also declined 17.2% year-over-year to 2,106 closed sales and sales dollar volume declined 26.5% to $1,129,639,482. New listings dipped 0.9% year-over-year to 2,764 listings while pending sales dropped 9.5% to 2,465 transactions.
Month-to-month data is important to help contextualize current figures against an overall trend of market stabilization. “Looking at the month-to-month data, we see that pending sales are consistent or rising in neighborhoods that are typically more affordable in areas outside Austin city limits. Along with rising inventory, that’s a good sign for housing market activity this spring.”
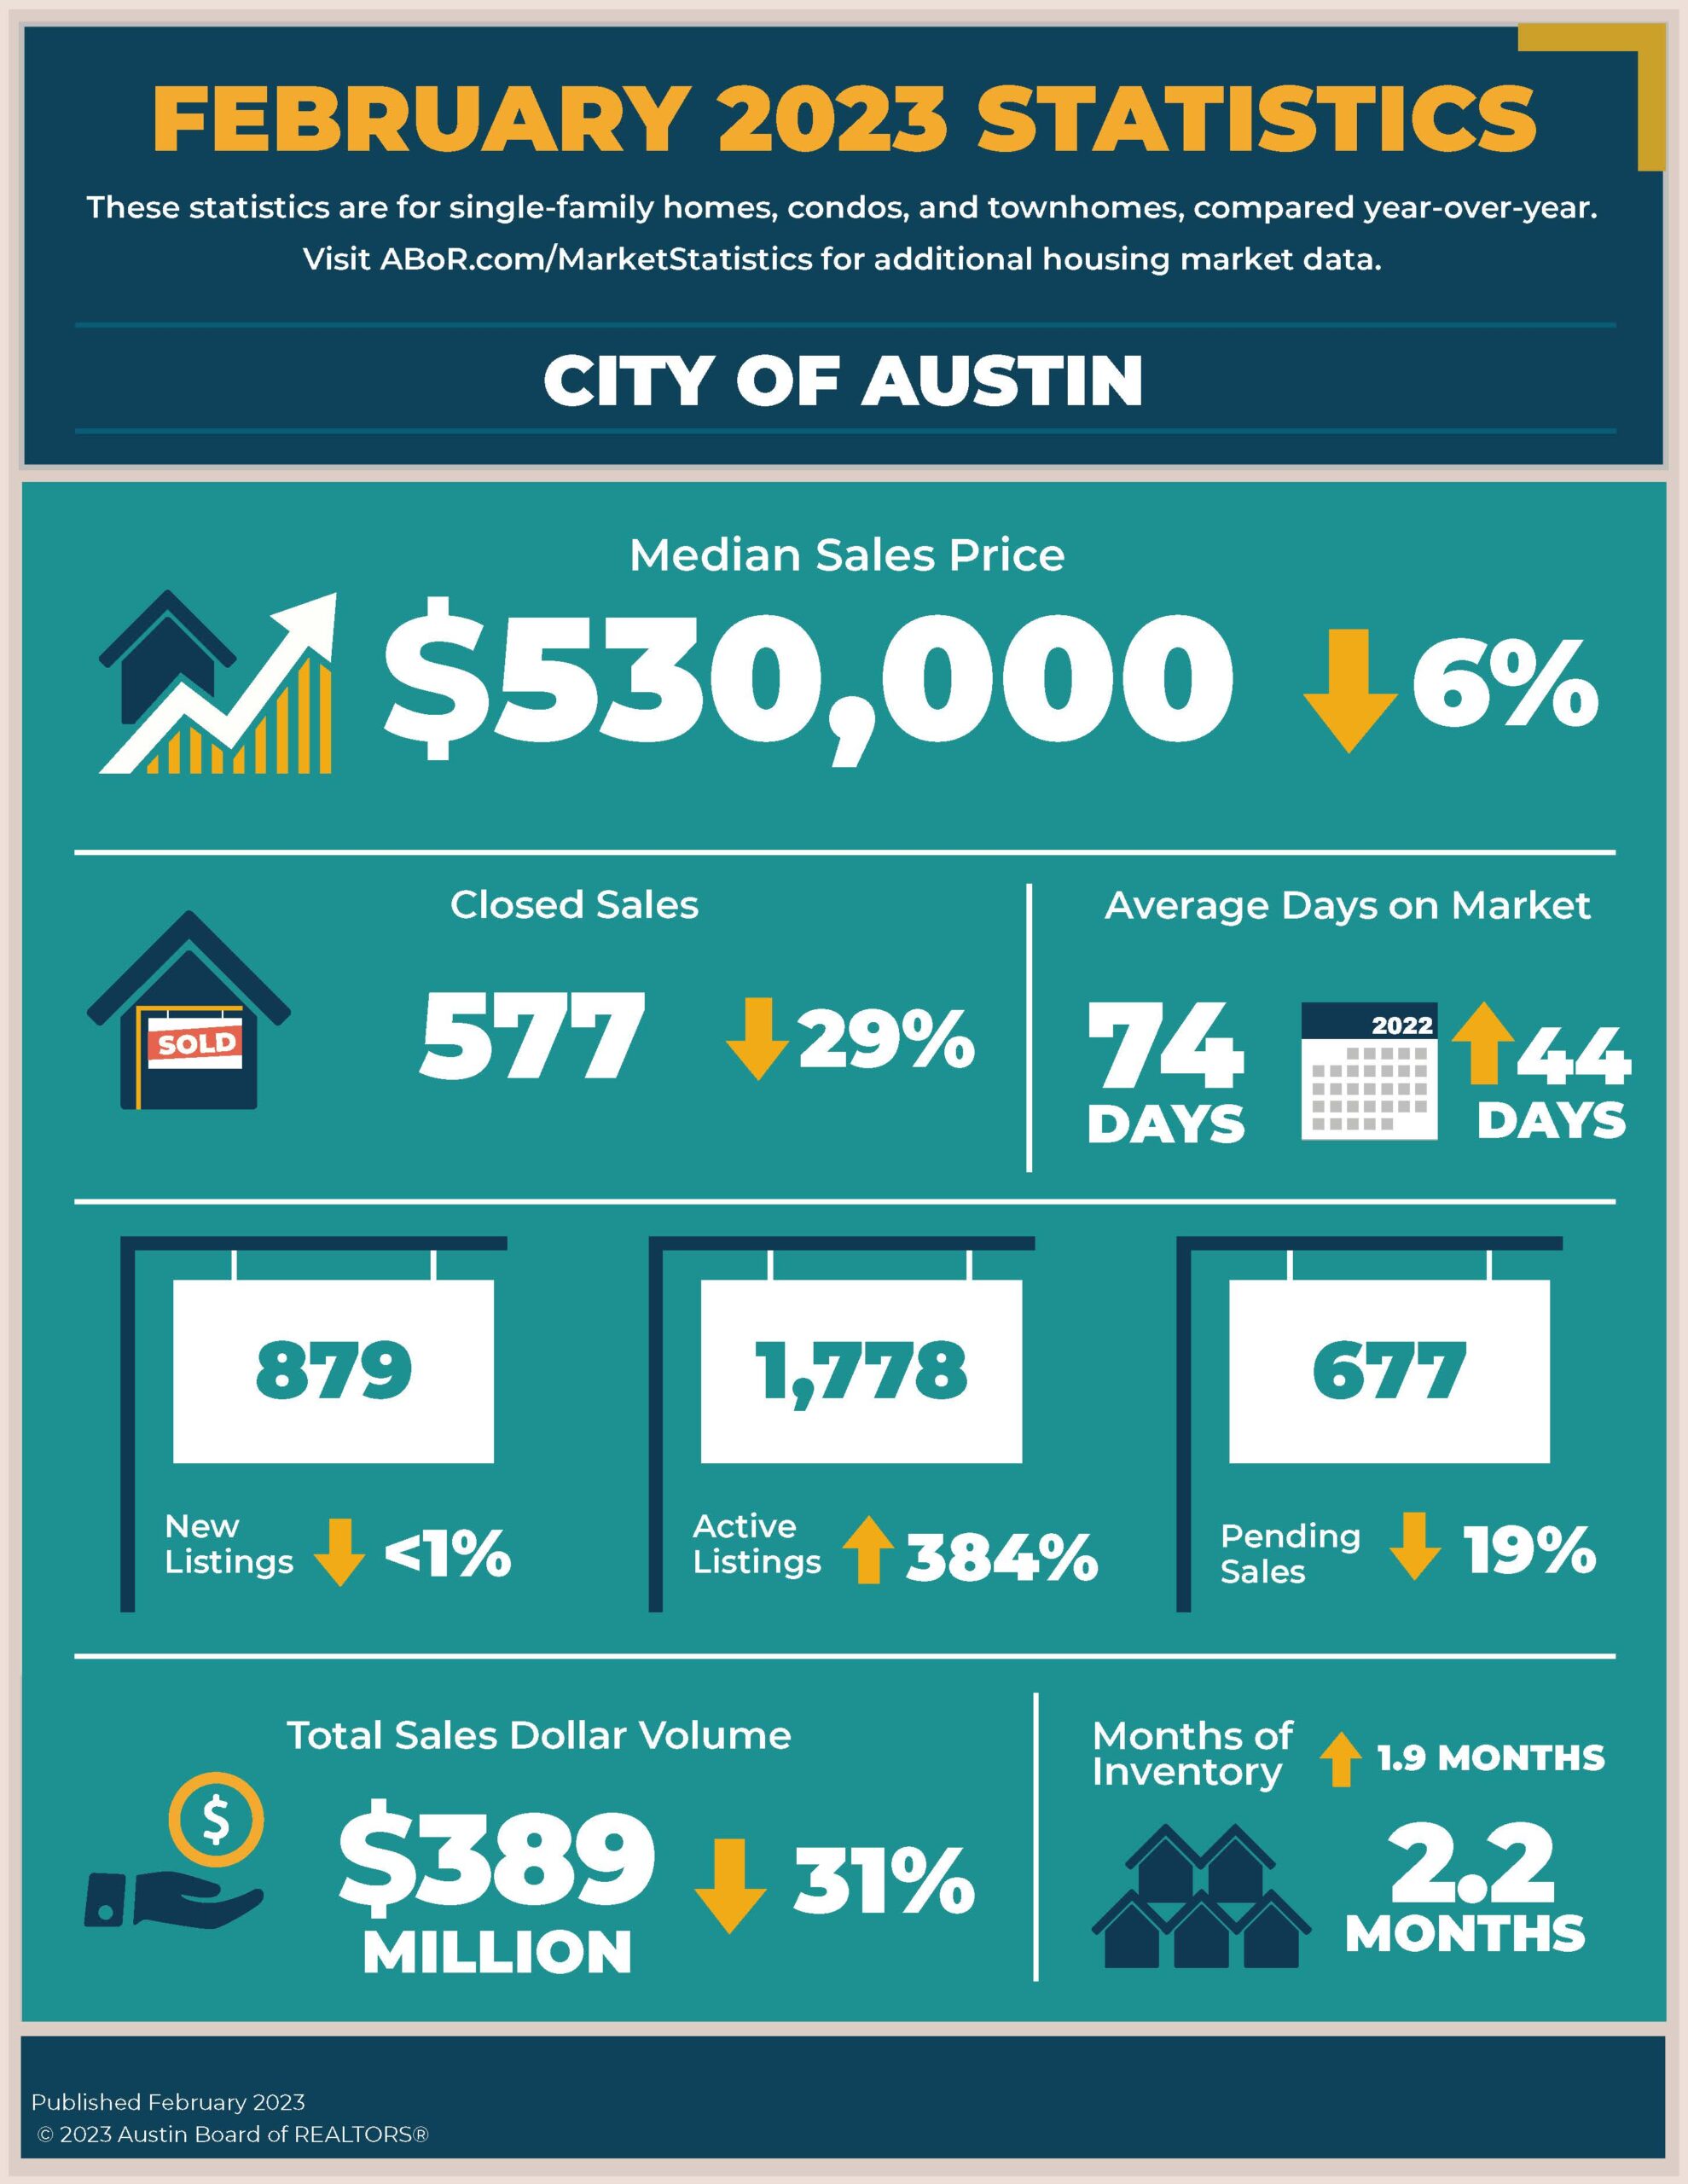
City of Austin
In February, home sales decreased 29.9% to 577 sales, while sales dollar volume decreased 31.9% to $389,252,605. At the same time, median price decreased 6.0% to $530,000 for the City of Austin. Last month, new listings slightly decreased 0.8% to 879 listings, active listings skyrocketed 384.5% to 1,778 listings as pending sales declined by 19.7% to 677 pending sales. Monthly housing inventory increased 1.9 months year over year to 2.2 months of inventory.
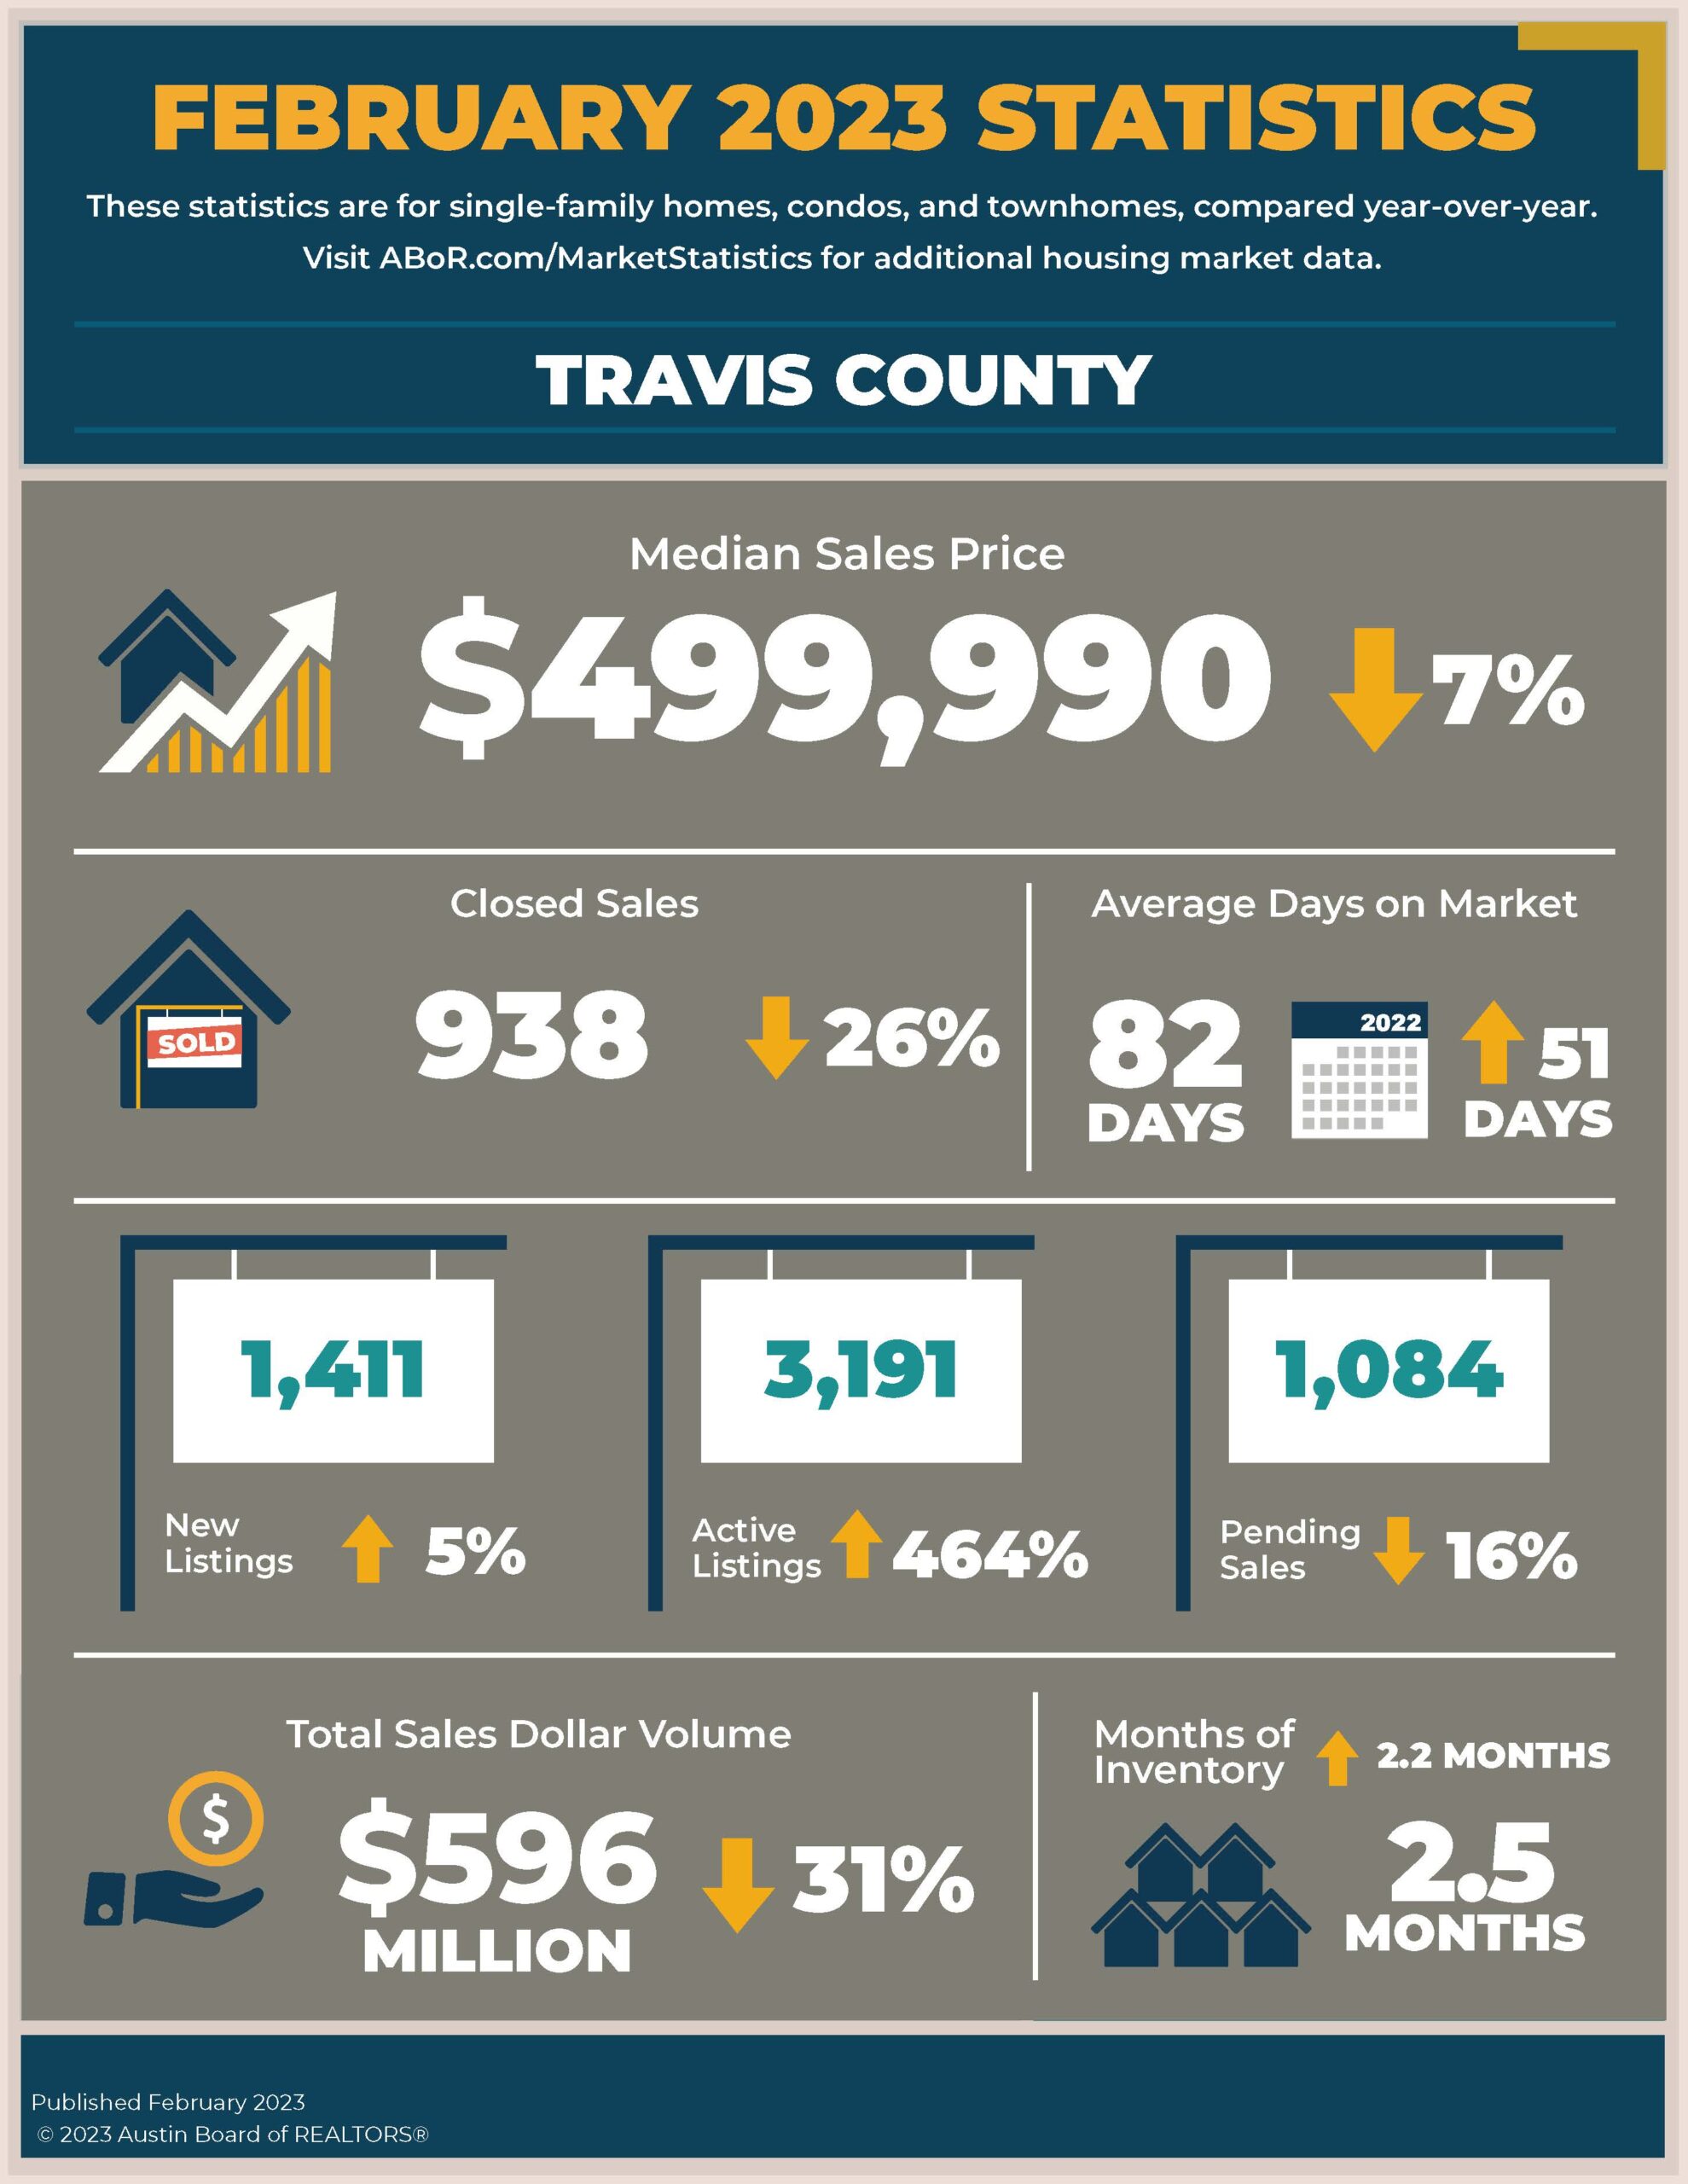
Travis County
In Travis County, home sales decreased 26.5% to 938 sales, while sales dollar volume decreased 31.4% to $596,185,542. Last month, the median price in Travis County slightly dipped 7.0% year over year to $499,990, while new listings increased 5.7% to 1,411 listings and active listings ballooned 464.8% to 3,191 listings year over year. Pending sales declined 16.2% to 1,084 pending sales as monthly housing inventory increased 2.2 months year over year to 2.5 months of inventory.
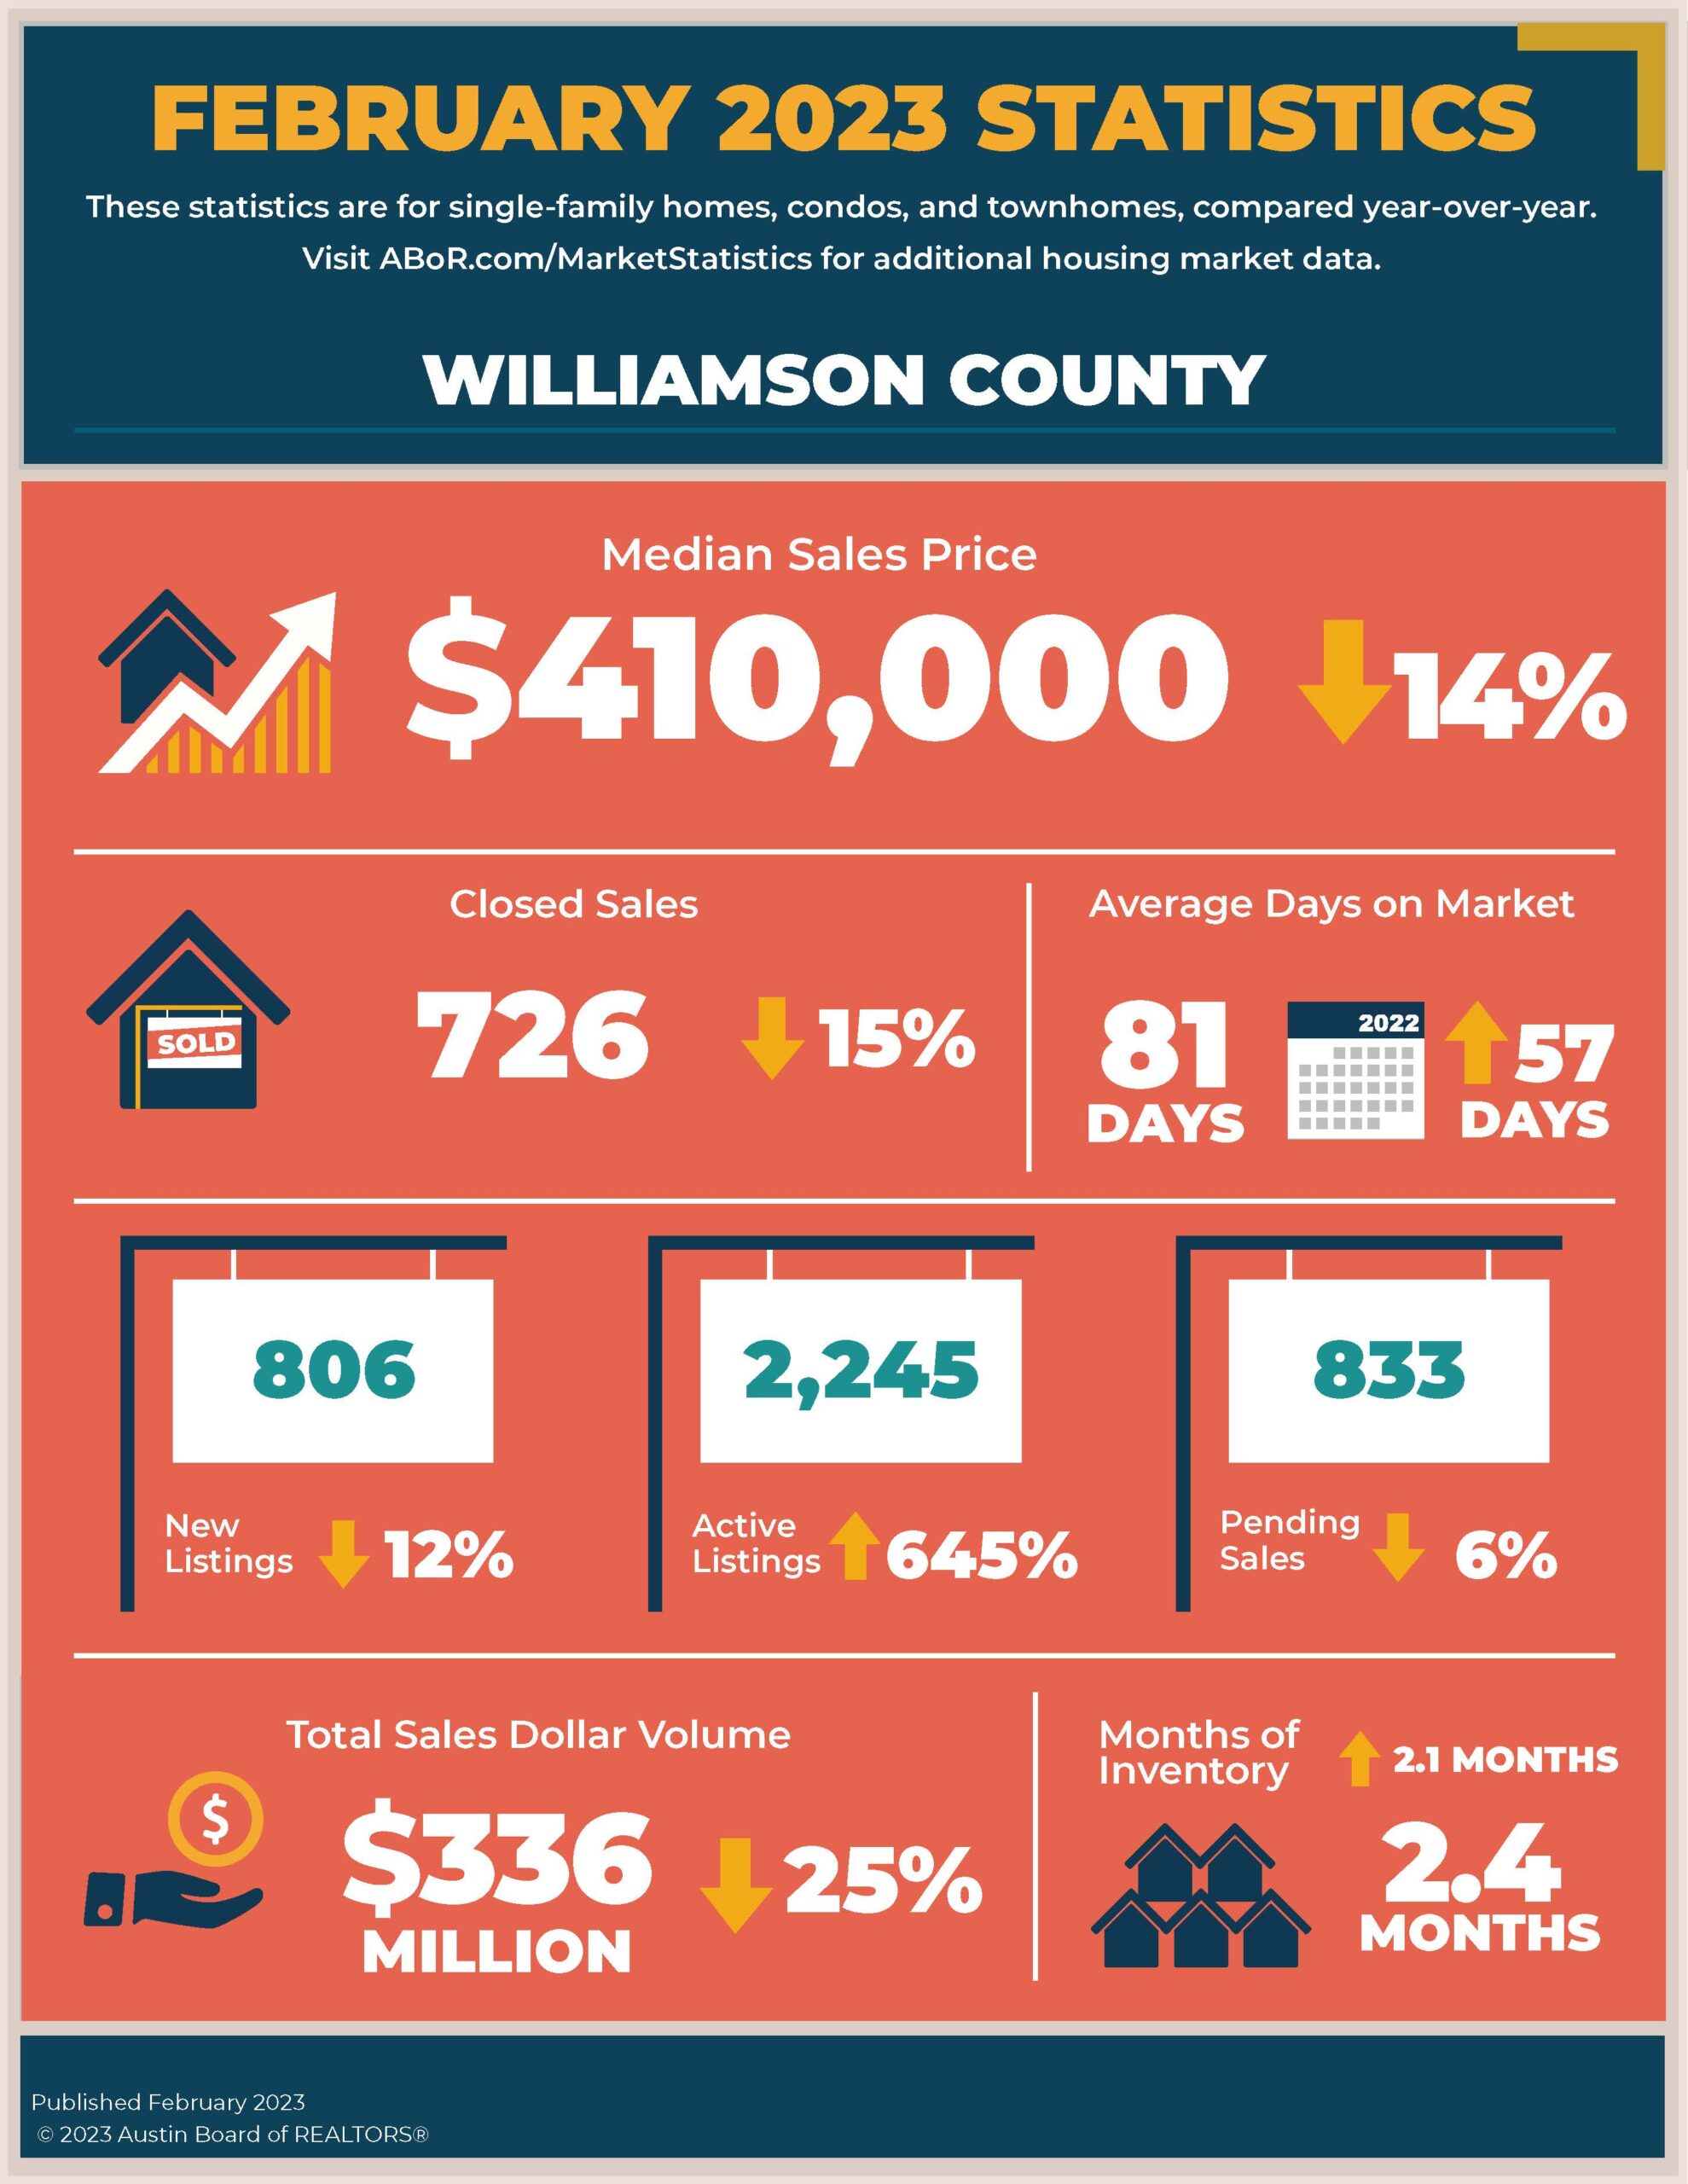
Williamson County
February home sales decreased 15.4% to 726 sales in Williamson County. Sales dollar volume declined 25.5% year over year to $336,341,463. The median price decreased 14.0% to $410,000 as new listings decreased 12.6% to 806 listings. During the same period, active listings soared 645.9% to 2,245 listings while pending sales slightly dropped 6.7% to 833 pending sales. Housing inventory rose 2.1 months to 2.4 months of inventory.
To compare February 2022 you can do so here, but if you would like to compare month to month simply check out last months stats here.
If you would like to see all of the area stats ABoR has everything you need.